![]()
Part I: CommentaryThe Big Picture
Funds are selling everything that is liquid, so gold and gold stocks are going down. However, I dont expect gold to go down any further.
[I havent seen an update that says Van K Tharp bought gold futures or gold ETF this guy enjoys talking about how you can make money trading in any market conditions, yet, he hasnt made any significant money from trading. But he likes to sell books and courses about how easily you can do it.]
[Update: (March 2012) This would have been an interesting group of trades since gold has traded up to around 1,800, then down below 1,600 where it was in October when Tharpy made his newsletter commentary, back up to around 1,800, and now roughly where it was in October.]
QEII has ended and right now there is nothing but low interest rates to support the economy. Banks are not lending and part of that is people who have money are paying off debt rather than borrowing. And right now it looks like we could be in for another round of deflation.
[What is this guy talking about another round of deflation? When was the last round of significant deflation? Later in his commentary he talks about inflation reported at 4%, but unofficially, according to shadowstats reporting inflation under the original methodology, inflation is 7%.]
Market volatility illustration over the last year.
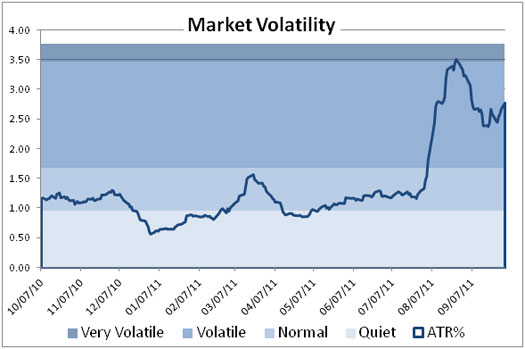
Tharpy was worried because, as he phrased it, For the DOW and S&P 500, every week last month was down. The NASDAQ 100 managed two up weeks and closed up slightly over the 2010 close. But the S&P 500, which is probably the best overall measure of the US stock market, closed last month down 8.47% on the year.
[Bear in mind hes been screaming in his newsletters about a secular bear market since 2004, yet theres no evidence he ever traded his market belief profitably but buy his book so he can encourage you to trade.]
Part III: Our Four Star Inflation-Deflation Model
Here is the data from our four star inflation-deflation model.
Ill spare you the data table, but he sums up as follows, We were in a strong inflationary period until QEII ended, but now we are starting to move into a deflationary environment according to the model. Ive added a column on the right to help you see the total score for the month.
Speaking of bank lending, the money multiplier situation had a nice upward trend until it got to about 0.8 and then it started down again. However, anything under 1.0 is terrible for the economy. Right now, this means that banks are lending about $78 for every $100 they have. Since the historical norm is about $300 loaned out per $100 of bank capital, you can see that this lending situation remains a serious hindrance on growth.
[Ill say something positive here, Tharpy has at times seemed that he has become better educated about the nature of the Federal reserve and money creation but say for fifteen years prior hes been in the dark about how the money system works as it is not even covered in any of his old newsletters or books.]
[Im not going to comment on his bank lending assessment the focus here is to point out his comment about being in a strong inflationary environment and his claim that we are starting to move into a deflationary environment according to his model. I dont have any faith in his models and Im guessing neither does he since he isnt able to use them to make any significant trades. As you can tell from his money management approach, which he terms position-sizing, he takes such small positions of less than one percent of equity. In his little computer game hell show you that this approach makes you a fortune in real life, well, not for him.]
[What should I say, sure Im tired of all this inflation lets have some potent deflation and have our dollars worth more, like what they were worth in the early 80s or 50s.]
The government reports unemployment at between 9% (U3) and 12% (U6), while Shadowstats version has it about 22%.
The government reports inflation to be about 4%, while Shadowstats reports it at above 7%. Shadowstats uses the original CPI calculation method the government used to report the inflation rate.
The government reports the GDP growth at about 2% and heading down now, but this is still positive so we are not in a recession. While the government uses their current inflation methodology to adjust its GDP rate, Shadowstats uses the real inflation rate to adjust its GDP calculation. Shadowstats shows GDP at -3% growth right now. Furthermore, it shows that the US has been in a recession since 2000 with the exception of the 4th quarter of 2003.
[Thats the most powerful comment: the US has been in a recession since 2000]
Part IV: Tracking the Dollar
Second, we are beginning a credit crisis similar to late 2007 to early 2009.
[Tharpy, do you think you are going to make money off this opinion? Actually trade on your market belief?]
General Comments
Warren Buffet is again making it sound like the economy is golden and this represents a time of real opportunity to buy bargains. Hes investing in the financial industry and buying back his own stock. To his credit, when you have billions and a very long-term perspective, this might be okay. But XLF is now around $11, and Id expect it to test its prior low of about $6. That prior low represents a further decline of about 45%. Would you want that kind of holding in your portfolio?
[Update March 2012: XLF goes up It never even came close to testing the low as Tharpy indicated.]

Our statistics now show that we are in Strong Bear Volatile territory during a secular bear market. These are the worst market conditions for long-term investors. Are you ignoring what weve been saying for the last few months and still long in the equity markets?
Look at the monthly candlestick graph of the S&P 500. Do you want to be long in the US stock market right now?
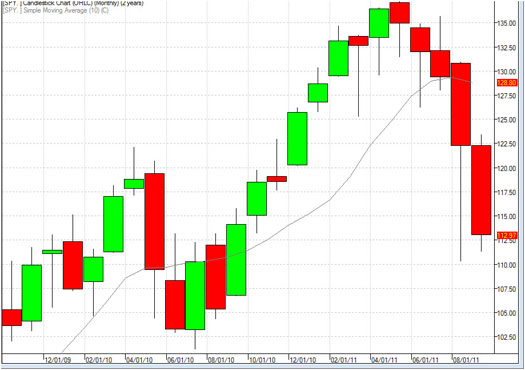
[He shows a chart but then guess what, the S&P goes much higher, as of March 2012]
I personally believe that the secular bear market has at least 5-10 more years to go. Shadowstats (with accurate statistics) shows only one quarter in which the US hasnt been in a recession since 2000 (4th quarter of 2003).
[Tharpy, but youve never made money with your secular bear market belief. Youve been screaming about that in your newsletter since 2004 and then the S&P 500 went up much higher.]
[And Tharpy in his books, at least prior to 2005 never discussed government statistics intelligently the way Shadowstats does only over the last few years or so has he began to wise up and mention this in his newsletters. ]
You should use the information in these monthly updates to determine which trading systems will work best rather than try to forecast the market. Which of your trading systems fit the current market type? The question implies that you have multiple trading systems and that you know how they perform under various market conditions. If you haven’t heard this before or the other ideas mentioned above, read my [junk] book Super Trader, which covers these areas and more so you can make money in any kind of market conditions.
[The Super Trader book wasnt a good read, not as crappy as your other books, but it showed that you are not a Super Trader Tharpy never achieved Super Trader status in terms of actually making any money in the market. Heres a book that has other people talking about how they traded and made money professionally, just so Tharpy can say, You see, I told you people make money from trading. Fine but you dont make money trading, and of course, there are super traders who do without ever having heard of you.]
Crisis always implies opportunity. Those with good trading skills can make money in this marketa lot of money. There were lots of good opportunities in 2009. Did you make money? If not, then do you understand why not?
[Tharpy, you didnt make a lot of money. You didnt see the crisis coming. There was no warning in your newsletters prior to the crisis. So tell everybody they can make a lot of money when you cant even get the job done.]
The refinement of good trading skills doesn’t just happen by opening an account and adding money. You probably spent years learning how to perform your current job at a high skill level. Do you expect to perform at the same high level in your trading without similar preparation? Financial market trading is an arena filled with world class competition. Additionally and most importantly, trading requires massive self-work to produce consistent, large profits under multiple market conditions. Prepare yourself to succeed with a deep desire, strong commitment, and the right training. Until the October update, this is Van Tharp.
[Self-work? If thats all it takes to produce consistent, large profits under multiple market conditions then whats holding you back? You havent made any trading income in any market condition, definitely nothing substantial.]
[Hes recognized for selling books and the Peak Performace Home Study course was crappy, it was boring, and there was no actual profit documentation, but dont take my word for it, heres a comment from a gal on a trading forum:]


